Anaemia is a symptom of various clinical disorders yet often underestimated as a functional disorder of red blood cells. Using the Sysmex Hematology analyser XN series, one can analyse the combined information of reticulocyte parameters – both related to quality and quantity – and so deliver the whole picture.
Alongside the pure reticulocyte count, the XN-Series RET application provides reticulocyte fractions (IRF, LFR, MFR, and HFR) that reflect maturity stages and therefore erythropoietic activity, and additional information on the quality of newly formed red blood cells by reporting the degree of reticulocyte haemoglobinisation (RET-He).
Additionally, RET provides information on hypo- and hyper chromic red blood cells , Red cell Hemoglobin RBC-He ,Delta He and fragmented cells. It automatically calculates the reticulocyte production index (RPI). RBC histograms can provide information on Microcytic and macrocytic red blood populations and are reported as MicroR and MacroR respectively.
HYPO-He and HYPER-He
HYPO-He and HYPER-He are parameters analysed in the reticulocyte (RET) channel. They are derived from the haemoglobin content of all mature RBC (RBC-He), which can be calculated based on the high-angle forward scatter (FSC). The FSC signal is converted into picograms (pg) using a proprietary algorithm and in healthy individuals the resulting RBC-He value is comparable to the mean corpuscular haemoglobin (MCH) value. Subsequently, this RBC-He value is used to determine HYPO-He and HYPER-He.
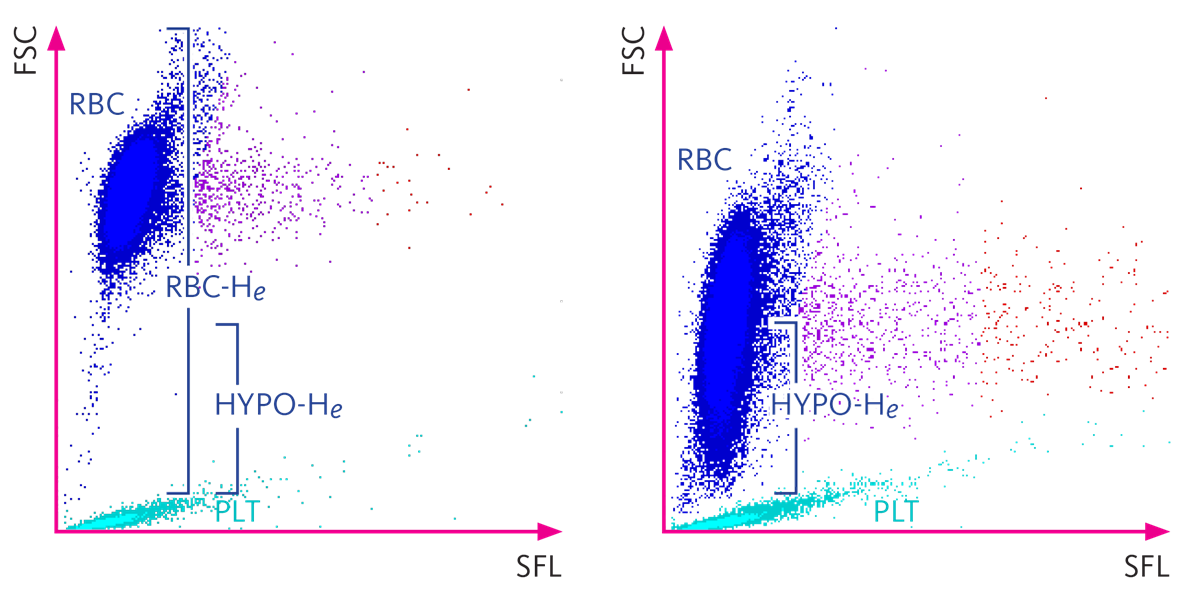 Figure 1: Each cell is plotted in the RET scattergram based on its fluorescence intensity (x-axis) and its high-angle forward-scattered light signal (y-axis), which reflects characteristics of both cell size and cellular content. The left panel shows a sample from a healthy individual with HYPO-He less than 1% and the right panel shows a sample with HYPO-He more than 60%
HYPO-He and HYPER-He are diagnostic parameters on XN-Class analysers that have the RET channel.
HYPO-He is used in RBC indices to distinguish between iron defiency anaemia and thalassaemia. along with other parameters. The use of HYPO-He as well as MicroR is recommended in nephrology guidelines such as the European Best Practice Guidelines (EBPG), National Kidney Foundation Kidney Disease Outcome Quality Initiative (NKF KDOQI).
HYPO-He is the percentage of RBC with cellular haemoglobin content lower than 17 pg, whereas HYPER-He is the percentage of RBC with cellular haemoglobin content higher than 49 pg.
RBC-He and Delta –He
While RET-He is a measure of the haemoglobin content in reticulocytes, the new diagnostic parameter RBC-He delivers information about the haemoglobin content of mature red blood cells. The parameter Delta-He is derived from the difference between these two parameters.
Delta-He values above the normal range may indicate an improvement in erythropoiesis, for example after EPO and/or iron therapy. In contrast, when Delta-He values are below the normal range for longer periods, this may indicate the onset of anaemia.
MicroR and MacroR
The parameters MicroR and MacroR are new diagnostic reportable parameters on XN-Class analysers and part of the complete blood count (CBC).
Red blood cells (RBC) and platelets (PLT) are counted in the RBC/PLT measurement channel using the sheath flow DC (direct current) detection method. Hydrodynamic focusing is used so that only single cells pass through the detector, and the resulting RBC size distribution shows a nearly Gaussian distribution.
Values for the MicroR and MacroR parameters are obtained from either end of the RBC histogram. The RBC histograms of samples with microcytic RBC are shifted to the left and often exhibit a shoulder on the left due to an increase in small RBC. In contrast, samples with macrocytic RBC generate histograms exhibiting a longer slope on the right. By applying two distinct discriminators at the lower and upper area of the histogram, a microcytic and a macrocytic population of red blood cells can be determined, and the resulting parameters reflect the microcytic (MicroR) and macrocytic RBC (MacroR) as a percentage of all red blood cells.
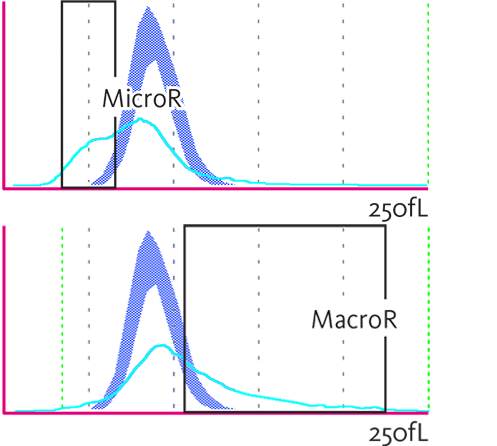 Figure 2: Microcytic RBC (MicroR, upper panel) and macrocytic RBC (MacroR, lower panel) in the RBC histogram.
In certain diseases, such as myelodysplastic syndrome, patients may have an MCV value that is within the reference range despite having an increased MicroR or MacroR. The parameters MicroR and MacroR are therefore useful to narrow down the possible causes of anaemia.
Fragmented Red blood cells (FRC*)
Sysmex analysers use the fluorescence flow cytometry method in the reticulocyte channel to measure fragmented red blood cells (FRC% and FRC#) as research parameters.
A specific area below the RBC area in the RET scattergram is used for identification of fragmented red blood cells. Due to the absence of nucleic acids in red blood cells the intensity of the measured side fluorescence signals (SFL) is extremely low. In addition, the high-angle forward scatter (FSC) is lower than that of intact red blood cells.
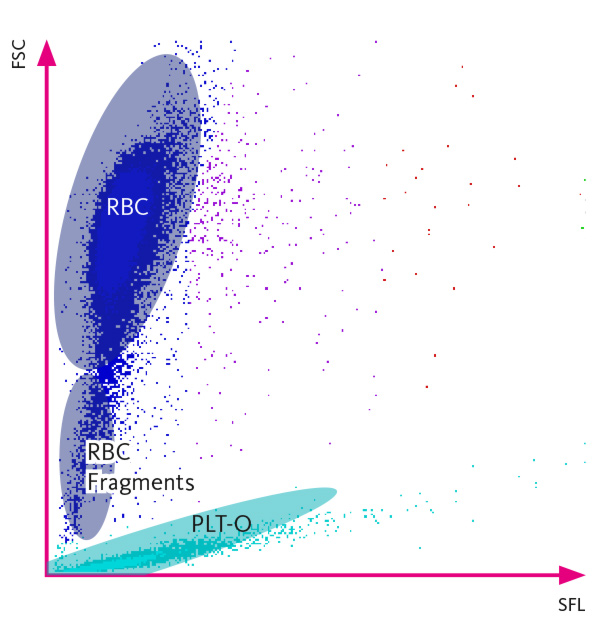 Figure 3: each cell is plotted in the RET scattergram based on its fluorescence intensity (SFL on x-axis) and its high-angle forward scatter (FSC on y-axis), which reflects characteristics of both cell size and cellular content. Fragmented red blood cells (FRC) are visible below the RBC population.
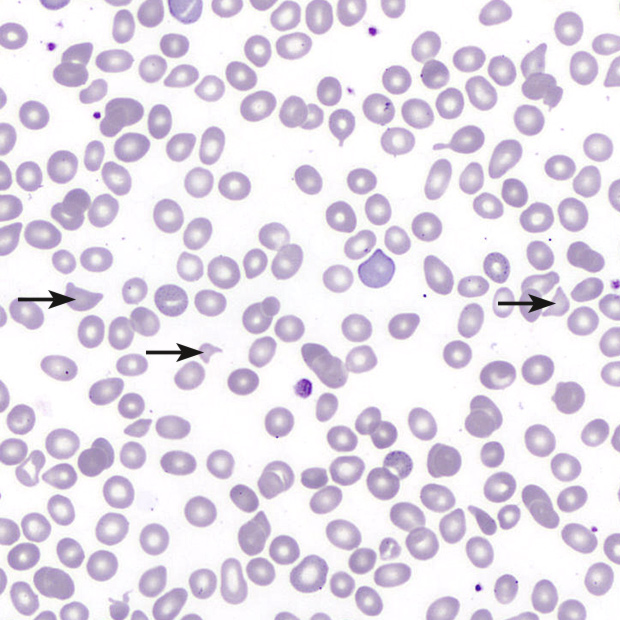 Figure 4: peripheral blood smear with ‘helmet’ cells (arrows).
Fragmented red blood cells are generally the consequence of mechanical damage, usually in the context of turbulent blood flow or contact with a pathologically altered endothelium, the latter occurring most commonly in the microvasculature. These abnormal shear forces destroy the integrity of the red blood cells, producing cell remnants that appear as ‘helmets’ (cells with two tapered and hornlike projections on either end) and other odd shapes when viewed under a microscope.
RPI (reticulocyte production index)*
The RPI reflects the erythropoietic bone marrow response in anaemic patients. This index, rather than merely the RET count alone, is used to assess the adequacy of the bone marrow response to anaemia in patients. It is not useful in the absence of anaemia. It is a research parameter available in XN Analyser.
RPI is defined as follows: RPI = (RET% × HCT) : (0.45 × days in blood). 0.45 represents the ideal haematocrit in the formula. At this 'ideal' HCT of 0.45, RPI is identical to the reticulocyte percentage, which is 'ideally' about 1% in normal healthy individuals. In an anaemic patient with adequate bone marrow response, the RPI should be > 2.0. However, the reverse conclusion (if RPI is < 2.0, the bone marrow response is considered inadequate) is not necessarily true.
A good marker of appropriate bone marrow response to anaemia is the increase of the absolute reticulocyte concentration, together with a marked increase of the immature reticulocyte fraction (IRF).
Reticulocyte Hemoglobin Equivalent (Ret-He)
Measurements of Ret He provide useful information in diagnosing anemia, ironrestricted erythropoiesis, and functional iron deficiency and response to iron therapy during rHuEpo therapy. It is generated by all Sysmex XE/XN analyzers (Sysmex Corporation, Kobe, Japan) and has been recognized as a direct assessment of the incorporation of iron into erythrocyte Hb and a direct estimate of the recent functional availability of iron.
A CHr value <29 pg predicts FID in patients receiving ESA therapy. A reticulocyte haemoglobin equivalent (Ret-He) value <25 pg is suggestive of classical iron deficiency and also predicts FID in those receiving ESA therapy .A Ret-He value <30.6 pg appears to have the best predictive value for likelihood of response to IV iron therapy in chronic kidney disease (CKD) patients on hemodialysis. Twenty-nine pg is the cutoff value that defines deficient erythropoiesis.
Recent studies confirm the clinical reliability of %Hypo He (derived from RBC-He) as marker of iron availability and the assessment of functional iron deficiency in hemodialysis patients 2.7% is the cutoff value which defines iron deficiency in those patients.
The percentage of hypochromic erythrocytes and the reticulocyte Hb content, reported by the modern analyzers, expand information at a cellular level:
- Provide Hb content information on red cells;
- Monitor changes in Hb incorporation into erythron;
- are more sensitive than indirect Biochemical measurements.
Several findings in the field of iron metabolism and erythropoiesis are modifying the traditional concepts on anemia. An appropriate combination of laboratory tests gives evidence of iron depletion, reflects iron restricted red cells production, and so will help to establish a correct assessment of the iron status and thus the appropriate treatment.
Differential Diagnosis of IDA and 𝛃-Thalassemia Screening
RetHe is reduced in IDA as well as in Thalassemia Trait. There are many Formula and index involving red cell indices to differentiate the two conditions in literature. The quantification of RBC subsets might provide complementary information useful for the differential diagnosis of microcytic anemia due to ID and screening for thalassemia.
The new Urrechaga Index includes the new RBC subsets: % MicroR & % Hypo-He. The % MicroR – % Hypo-He – RDW index has proven to be the most reliable index evaluated. The optimal cutoff, –7.6, provides sensitivity of 100%, which means 0% false-negatives; thus, all thalassemia carriers could be recognized. According to the results of this study, an M-H-RDW value higher than –7.6 is a highly suspicious feature of β-thalassemia trait, and the HbA2 level must be quantified to confirm the presence of the disease. Specificity is also high, 92.6%; it is assumed that it would mean 7.4% false-positives, but these samples, with HbA2 levels within the reference range, could be correctly diagnosed.
Reduced RetHe and M-H-RDW, derived from RBC extended parameters provided by the Sysmex XN analyzer, could be used as a laboratory-based criterion for the selection of samples for thalassemia testing, with a high degree of accuracy. It can be incorporated as a Rule with a comment of Suspect BTT or IDA as the case maybe thus avoiding manual calculation and is available along with the other CBC parameters.
References:
- Reticulocyte Hemoglobin Content (RET-He): A Parameter with Well-Established Clinical Value Sysmex America White Paper
- Identification and Monitoring of Functional Iron Deficiency in ESRD Patients Using an Early Erythroid Population Sysmex America RET-He White Paper
- Guideline for the laboratory diagnosis of functional iron deficiency
- Wayne Thomas,1 Rod F. Hinchliffe,2 Carol Briggs,3 Iain C. Macdougall,4 Tim Littlewood5 and Ivor Cavill 6 on behalf of British Committee for Standards in Haematology- British Journal of Haematology, 2013, 161, 639–648
- The Role of Automated Measurement of RBC Subpopulations in Differential Diagnosis of Microcytic Anemia and 𝛃-Thalassemia Screening Eloísa Urrechaga, PhD,1 Luís Borque, MD, PhD,2 and Jesús F. Escanero, MD, PhD2
- www.sysmex-europe.com